Google Ads vs Facebook Ads: Which Is Better for Leads?
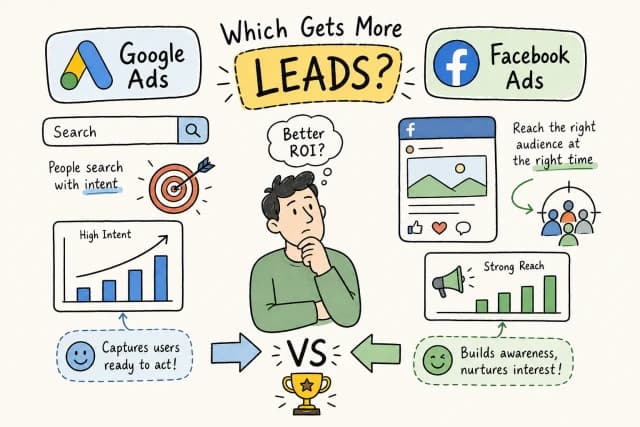
When weighing up Google Ads vs. Facebook Ads for lead generation, the answer is rarely one or the other. Google Ads wins when your potential buyers are already searching for what you sell. Facebook wins when you need to reach people who do not yet know they need your offer. Neither platform is universally better: the right choice depends on where your buyer sits in their decision journey, your industry, and how your budget is structured. At ThinqMedia, this is the question Nigerian business owners ask most often before committing their ad spend, and the honest answer is always grounded in demand signals, not platform reputation.
This article breaks down intent mechanics, Nigeria-specific cost benchmarks, audience targeting differences, and which platform suits which business type. By the end, you will have a data-backed basis for your next allocation decision rather than a coin flip.
Key takeaways
Intent is everything: Google Search captures buyers who are actively looking; Meta creates demand among people who are not yet searching.
Cost per qualified lead matters more: A low-cost Facebook lead that never responds is ultimately more expensive than a higher-cost Google lead that books a consultation.
Service businesses lean Google: Legal, healthcare, logistics, and real estate searches drive high-intent traffic that converts at stronger rates.
Discovery brands lean Meta: E-commerce, fashion, and education brands benefit from Facebook and Instagram's reach among 89.2% of Nigerian internet users aged 16 and above (DataReportal, 2026).
Combined outperforms either alone: ThinqMedia campaign data shows a full-funnel Google-plus-Facebook approach delivered 3.56x ROAS versus 2.07x for Google only across comparable 90-day periods.
Track the right KPIs: Optimise for cost per qualified lead, not raw clicks or form submissions.
What is the real difference in how these two platforms capture leads?
The foundational distinction between Google Search and Facebook advertising is not creative format or cost structure. It is the direction of the demand signal. One platform captures intent that already exists; the other manufactures it.
How Google Search captures active buying intent
Google Search puts your ad in front of someone who has already decided to look for a solution. When a Lagos-based SME owner types "digital marketing agency Nigeria" or "business loan Abuja," they are raising their hand in real time. This declared intent is the single biggest reason Google Search typically produces fewer but higher-quality leads than social platforms. Commercial keywords convert at a fundamentally different rate than display inventory because the buyer has self-selected into the consideration phase before your ad even appears.
This demand-capture model means your budget is spent on people who are ready to act, not people who might become interested. The trade-off is volume: there are only so many people searching for your specific offer in a given month, and that ceiling limits how far you can scale on Search alone.
How Facebook builds demand among people who are not searching yet
Facebook and Instagram work from the opposite direction. They match your ad to people based on demographics, interests, behaviours, and algorithmic signals, not active queries. This makes Meta the stronger channel for products or services where the buyer does not yet know to search for you. A first-time homebuyer does not search "off-plan apartment Lekki" until someone plants that idea through a compelling ad or a friend's recommendation.
This discovery mechanic produces higher lead volumes but requires more qualification effort downstream. Social proof, visual storytelling, and repeated exposure do the persuasion work that a search query already handles on Google. Neither approach is inferior: they serve different stages of the buyer journey, and the strongest campaigns use both.
How do Google Ads vs Facebook Ads costs compare for Nigerian campaigns?
Comparing platforms on raw CPC alone is a common mistake. The metric that drives allocation decisions is cost per qualified lead, which requires understanding what you are paying for at each stage of the funnel.
Nigeria CPC and CPM benchmarks for 2026
The figures in the table below are modelled planning benchmarks drawn from 2026 Nigeria market data. Google figures represent averages across Search campaigns; Meta figures are directional ranges that vary by objective, placement, and audience.
Platform Average CPC Average CPM Google Search Ads ~₦487 per click ~₦14,704 per 1,000 impressions Facebook/Meta Ads ₦60–₦350 per click ₦600–₦3,500 per 1,000 impressions
Google's higher CPC reflects the intent premium built into every click. The person clicking that Search ad was already looking for a solution, which justifies the price difference. Meta's cheaper clicks often carry lower purchase or inquiry intent, meaning you may need more of them to produce the same downstream outcome. In competitive sectors like finance, legal, and real estate, Google Search CPC in Nigeria can climb to several thousand naira per click for high-value keywords.
Cost per lead versus cost per qualified lead
Across Nigerian industries, Facebook Lead Ads typically generate leads in the ₦9,000–₦25,000 range, while Google Search Ads produce leads in the ₦14,000–₦45,000 range, with legal and high-value real estate campaigns often exceeding that ceiling. These are planning ranges that vary significantly by industry, city, and campaign objective. On paper, Facebook looks cheaper by 30–50%. In practice, a low-cost Facebook lead that never answers a call costs more in sales team time than a higher-cost Google lead that arrives ready to book a consultation. The specific figures will differ by business, which is precisely why tracking your own cost per qualified lead matters more than relying on industry averages.
Nigerian businesses should track cost per qualified lead, meaning a lead that actually responds, meets your criteria, and progresses through your sales process. Contact rate, qualification rate, and eventual close rate determine profitability, not the raw number on your ads dashboard. Optimising for form submissions without tracking what happens afterward is one of the most expensive habits in paid media.
Which type of business wins on Google, and which wins on Facebook?
Platform selection becomes significantly clearer once you match your business model to where your buyer's intent actually lives. The two broad categories are search-driven service businesses and discovery-led consumer or e-commerce brands.
Businesses that typically get stronger results from Google Ads
Service businesses with explicit search demand consistently outperform on Google Search. Real estate agencies, legal firms, healthcare providers, logistics companies, and local service providers all benefit because their buyers actively search commercial phrases before making contact. When someone in Abuja types "emergency plumber" or "lawyer near me," they have already decided to hire someone. The only question is who they call first.
ThinqMedia campaign data supports this pattern. An Abuja plumbing company generated 87 leads at approximately ₦2,300 per lead over 90 days through Google Search. A Lagos law firm produced 24 consultations at around ₦12,500 each through tightly themed Search campaigns targeting high-intent legal queries. These results reflect the fact that search demand existed before the campaigns launched; the ads simply intercepted it.
Businesses that typically perform better on Facebook and Instagram
E-commerce brands with visual products, B2B companies building brand awareness before a long sales cycle, education and training businesses targeting broad demographics, and hospitality or retail brands relying on discovery and social proof consistently outperform on Meta. Facebook and Instagram reach 89.2% of Nigerian internet users aged 16 and above (DataReportal, 2026), making them the stronger prospecting channel for any brand that needs to create demand before it can capture it.
Nigerian social-media users show high product-research behaviour on these platforms. According to a 2025 consumer survey cited by Statista, 98.2% of Nigerian social-media users reported researching products via social media, though that figure reflects survey respondents and should be read as directional rather than universal. For an e-commerce brand selling fashion or beauty products, or an online training provider targeting working professionals, Meta offers the combination of reach, visual storytelling, and algorithmic targeting that Google Search cannot replicate. The goal is not to generate one click. It is to build enough familiarity and desire that when the buyer eventually searches, your brand is already top of mind.
Does running both platforms together actually improve results?
The more useful question is not which platform is better in isolation. It is how to sequence them for the highest combined return.
What Nigerian campaign data shows about combined channel performance
ThinqMedia campaign data from Nigerian accounts shows the compounding effect of combining both platforms. Google-only campaigns tracked at 2.07x ROAS over 90 days. Adding Facebook retargeting to those same Google campaigns lifted performance to 2.60x. A full-funnel approach- Google for intent capture, Facebook prospecting for new audience segments, and Meta retargeting for visitors who did not convert- produced 3.56x ROAS over the same period. These are internal case-study results rather than independently audited benchmarks, but the directional logic is consistent with how full-funnel media planning works across markets globally.
The mechanism is straightforward. Google captures buyers who are already ready to act. Facebook retargets those who visited your landing page but did not convert, and simultaneously prospects new audiences at the top of the funnel. Rather than two platforms competing for the same budget, they serve different roles in the same journey, which is what creates the compounding effect. Buyers move through the funnel faster when both channels work in sequence.
How to split your budget between the two platforms
Starting allocation should reflect your primary demand signal. Search-driven service businesses, plumbers, lawyers, healthcare clinics, should weight approximately 60% toward Google, with 40% on Meta for retargeting and upper-funnel awareness. Discovery-led e-commerce or consumer brands should weight 60% toward Meta for prospecting, with 40% on Google for intent capture and branded search. The right split changes as campaign data accumulates, which is why ongoing daily optimisation matters more than getting the initial ratio perfect. Shift budget in 10–20% increments toward whichever channel produces better cost per qualified lead after 30 days of clean data.
How should you structure your first 90 days on the right platform?
The first month of any paid media campaign is a data-collection exercise as much as a sales exercise. Structure it accordingly.
Starting with Google Search: what to prioritise in weeks one to four
Begin with tightly themed campaigns built around high-intent commercial keywords using exact and phrase match. Each ad group should have a dedicated landing page that directly matches the ad's promise: if your ad says "business loans in Lagos," the landing page should open with exactly that offer, not a generic homepage. Set up conversion tracking for calls, WhatsApp clicks, and form completions before spending a single naira. Add negative keywords from day one to exclude research queries that consume budget without intent to buy. Use responsive search ads with location-specific headlines and a concrete offer, whether that is a price range, a response time commitment, or a free consultation.
Starting with Facebook Ads: what to prioritise in weeks one to four
Launch with one campaign objective: Lead Ads or Messages for service businesses, or a conversion campaign for e-commerce. Test a short UGC-style video against a clean static image in the first two weeks. Keep your audience narrow to control initial cost per lead before scaling to broader segments. Set up the Meta Pixel and Conversions API before the campaign goes live so your optimisation algorithm has clean, reliable attribution data from the start. Campaigns launched without proper server-side tracking are effectively flying blind, particularly after iOS privacy changes affected browser-based tracking.
KPIs to track from week one
The metrics you track from launch determine whether your campaign improves or simply spends. Monitor these four from day one:
Cost per qualified lead: not raw cost per form submission or click, but the cost to acquire a lead that actually responds and meets your buyer criteria.
Lead-to-contact rate: the percentage of leads that answer when you follow up, which reveals lead quality independent of acquisition cost.
Conversion rate by traffic source: to compare platform quality by downstream outcomes, not just click volume.
Return on ad spend at gross profit level: calculate your break-even ROAS before judging early campaign numbers. A business with a 30% contribution margin needs approximately 3.33x ROAS before accounting for overhead.
Businesses running paid campaigns without a clear attribution model consistently compare the wrong numbers. Platform-reported ROAS and independently tracked revenue rarely match, and decisions made on dashboard data alone lead to budgets being moved toward channels that look better on screen rather than channels that produce profitable customers.
Google Ads vs Facebook Ads: making the right call for your business
The core verdict is straightforward: Google Ads wins when your buyers are actively searching; Facebook wins when you need to build and capture demand at scale. For most Nigerian businesses, the highest-performing path is not one platform or the other. It is the right sequencing of both, with budget allocated to where your buyer actually sits in their journey at any given time.
The challenge is that most businesses do not have the time or the data history to work this out through trial and error. Each month of inconclusive testing is a month of budget that could have been deployed profitably. That is precisely where ThinqMedia comes in. Rather than guessing which platform deserves your next ₦500,000 in ad spend, the team runs a structured channel assessment based on your industry, offer, margin, and existing demand signals, then builds the campaign architecture around what the data actually supports.
If you need a data-driven answer to the Google Ads vs Facebook Ads question for your specific business, reach out to ThinqMedia and request a paid media review. The right platform mix is determinable from your data, and that is exactly what a structured channel assessment produces.
Frequently Asked Questions
How do I know if a lead is actually qualified or just a form fill?
A qualified lead is one that responds, meets your criteria, and progresses through your sales process. I measure this as contact rate and qualification rate rather than raw form submissions, and I track cost per qualified lead as the primary KPI to compare channels.
If I only have a small ad budget, which platform should I start with?
Start with the platform where your buyer's intent already lives and treat the first month as data collection. For search-driven service businesses, I weight roughly 60% to Google and 40% to Meta for retargeting; for discovery-led brands, I weight 60% to Meta and 40% to Google, then shift budget in 10–20% increments after 30 days of clean data.
How long before I should expect meaningful ROAS data?
You should expect meaningful data after 30 days and a clearer ROAS picture over a 90-day window. I use 30 days for initial direction and 90-day ROAS comparisons. ThinqMedia case data showed Google-only at 2.07x ROAS and a full-funnel Google-plus-Facebook approach reaching 3.56x over comparable 90-day periods.
What tracking do I need to set up before I spend a naira on ads?
Set up conversion tracking for calls, WhatsApp clicks, and form completions, plus the Meta Pixel and Conversions API for Meta campaigns. I also add negative keywords on Search from day one and calculate break-even ROAS so optimisation is based on reliable attribution rather than platform-reported metrics alone.
Admin Strategist
Thinq Media Strategy